CREATE YOUR MANAGEMENT DASHBOARDS & MONITOR YOUR PERFORMANCE INDICATORS
A software for your dashboards
Because the main added value of a quality management software package is the feedback of indicators,
Qualios offers you a tool for building management dashboards and charts.
Request your demonstration now !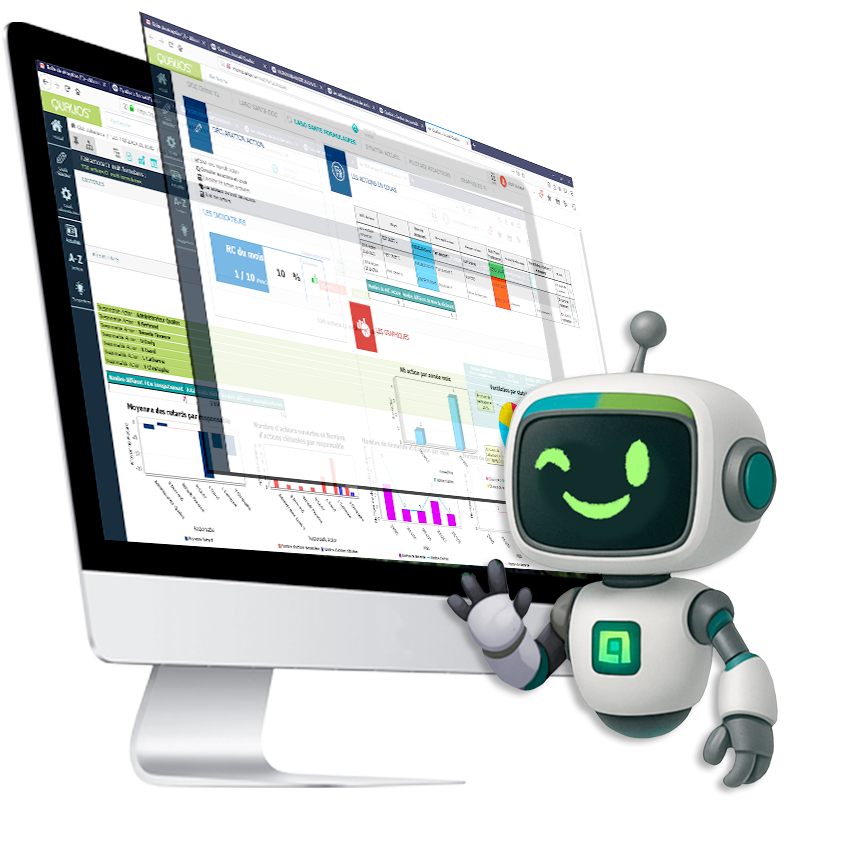
Qualios offers you a tool for building management dashboards and charts.
Request your demonstration now !
With our tool, you can create general reports with your indicators, organized according to your criteria and needs: by month, year, agency, type of dysfunction... You select the data and benefit from relevant indicators, which take account the specificities of your company (exceptions, trends...) in order to highlight significant results and gaps.

MeASURE
by counting the traditional number of NCs, the number of internal audits performed, scrap from machine A or number of adverse events from process B, etc.

MONITOR
by simultaneously disseminating, here and there, within the processes themselves, pointers or markers capable of presenting and reporting information in real time.

Pilot
in the light of the information collected, while enjoying a clear view of your activity and processes: monitoring, calculations, research, etc.
POWER AND EASE
The functionalities of our software
Dashboard
Our software makes your daily work easier, especially when it comes to data processing - summary tables and graphs are automatically generated - and the overall budget management of your company - tracking expenses, sales revenue, profit...

Build custom management dashboards
Create custom charts
Track your indicators and alerts, actions and their origin(s)
Configure automatic e-mail notifications if a certain threshold is reached
View your dashboards with a simple browser
Manage access rights: consultation, publishing, administration
Enjoy a user-friendly and easy-to-use interface
Your data and charts are updated in real time
Use of pre-configured queries you have configured yourself
Realization of specific requests
 |
VISUALISATION AND TRACEABILITY
A global vision of your performance indicatorsOur analytical software will allow you to clearly visualize your data, regardless of its source - as a result, you will be able to manage your company more easily with up-to-date information in real time. |
|
VISUALISATION AND TRACEABILITY
Define your own KPIsThe tool is perfectly adapted to your business and your own Key Performance Indicators (KPIs). Access the desired level of detail and the original record with a simple click.
|
 |
VISUALISATION AND TRACEABILITY
A decision-making help
Benefit from clear figures and indicators that will facilitate your decision-making ! The remarkable values established by the tool will be used not only to better assess risks, but also to anticipate significant changes.
The highlights of our dashboard software
- SaaS access from any terminal
- Automatic collection and processing of your indicators
- Restitution in the form of clear dashboards
- Information updated in real time
A fast and efficient implementation
- Turnkey solution with our ready-to-use packs
- Import of data from any source
- Filter your results according to your needs
- Fast export to XLS or CSV
TRUST AND SATISFACTION
They trust us